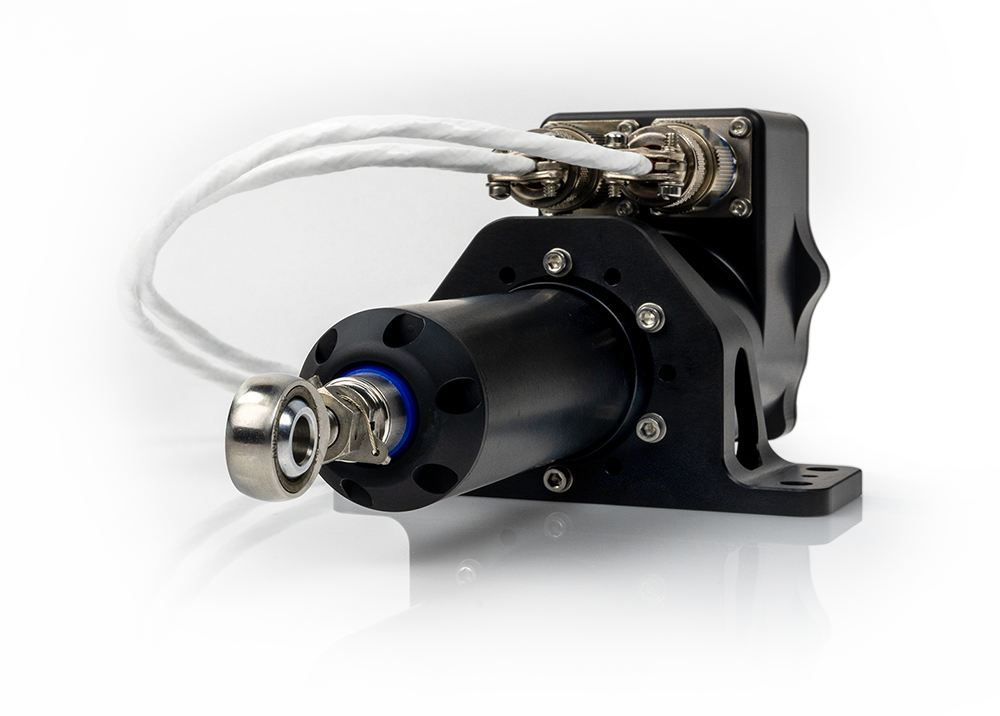
servocylinder
High Performance Linear Servo Actuator
- BLDC control electronics and contactless absolute position feedback built-in
- Control via CAN 2.0B, RS-422 serial, RC PWM, and more
- Lightweight, high power density, high bandwidth
- Ideal for harsh shock and vibration environments in the aerospace and defense industries
- 100% electrically conductive hardcoat anodized aluminum enclosure for EMI/EMC protection
- Typical applications include swashplate and tail-rotor control, fixed wing UAV control surfaces, thrust vector control of rocket engines, UGV brake and transmission control, etc.
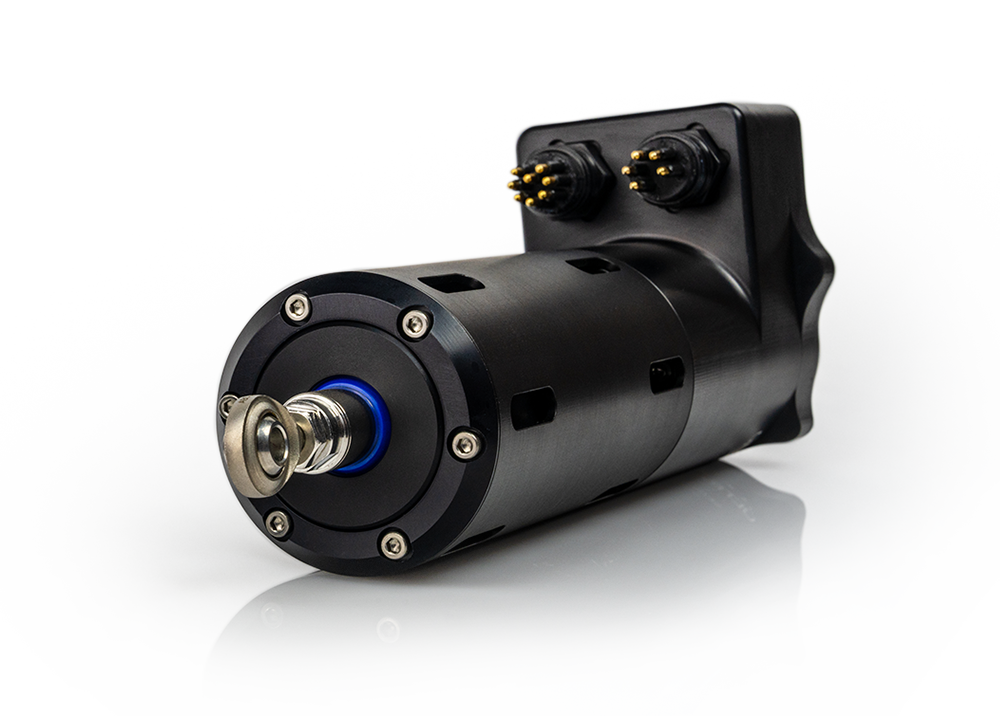
30 Years of Underwater Heritage
- BLDC control electronics and contactless position feedback built-in
- Pressure balanced oil-filled for operation to 6000+ meters (10,000 PSI)
- Control via CAN, RS-422 serial, digital signals, and more
- Ideal for harsh maritime applications above and below the waterline
- Hydrofoils, ROV control surfaces, subsea valves, release mechanisms, USV control…
- Shallow underwater versions available for low cost subsea actuation: hydrofoils, littoral uses, USV control
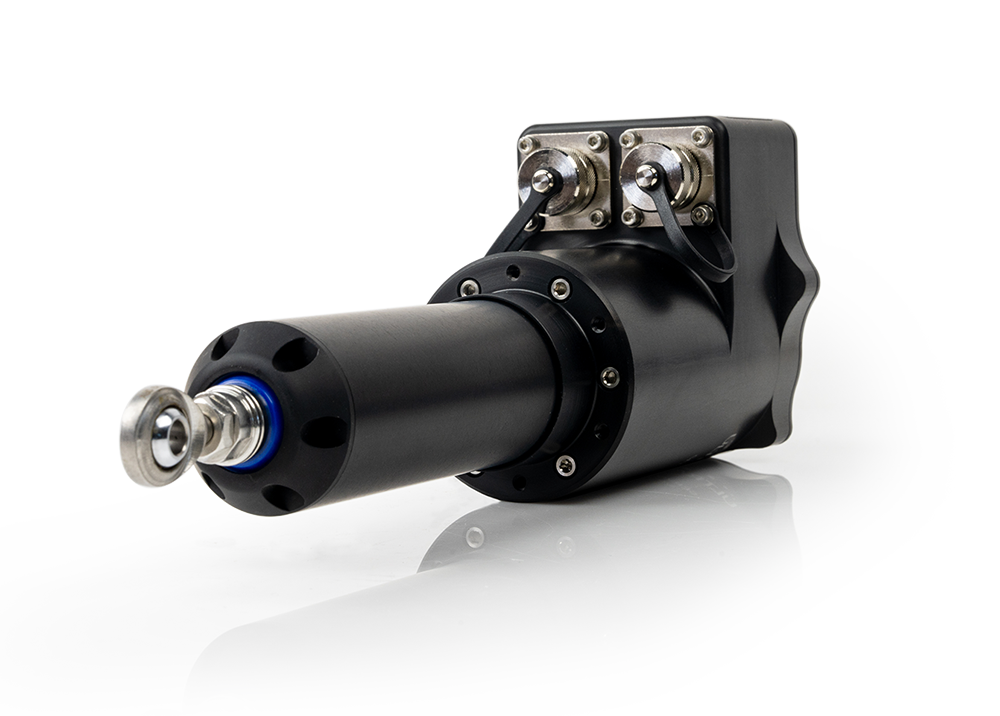
Robust and Reliable for Industrial Applications
- Industrial-grade linear servo actuator
- Built-in BLDC control electronics and absolute position feedback
- Expanded control options: CAN, RS-422 serial, 4-20 mA in/out, ±10 VDC
- IP65 sealing for wet and dusty environments
- Ideal for industrial automation tasks, environmental cells, dynamometers, outdoor applications
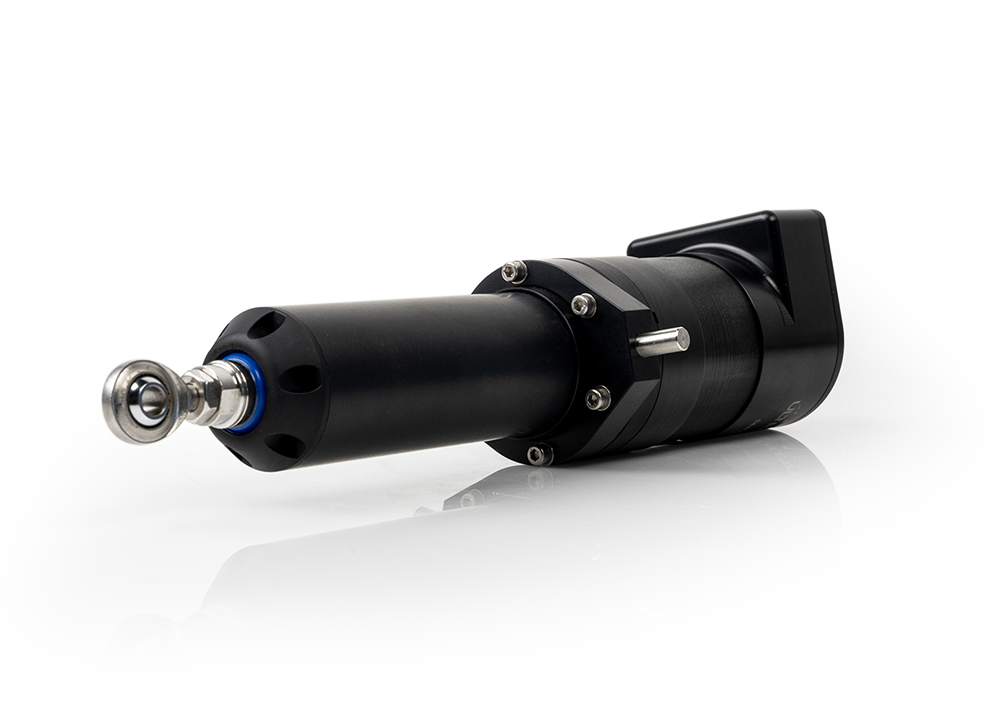
Your Cost-Effective Solution for Precision Control
- Complete linear servo system
- Built-in BLDC control electronics and absolute position feedback
- Control options: CAN, RS-422 serial, 4-20 mA in/out, ±10 VDC
- Non-sealed, lowest cost version
- Suitable for benchtop applications, laboratory experiments, clean environments
Integrated Controller Options
| Control Modes & Features | Classic ControllerOption Code “N” | Industrial ControllerOption Code “P” | CAN ControllerOption Code “C” | Deepsea Controller Option Code “Q” |
|---|---|---|---|---|
| RS232 Serial w/ Command Line Interface (CLI) |
0
|
|||
| RS422 Serial (Full-Duplex, 4-wire) w/ Command Line Interface (CLI) |
0
|
0
|
||
| RS485 Serial (Half-Duplex, 2-wire) w/ Command Line Interface (CLI) *Does not command motion |
0
|
* | ||
| CAN 2.0B (Configurable Protocol) |
0
|
0
|
||
| CANopen (CiA DS301, CiA DS402) |
0
|
|||
| Analog Voltage (-10 V to +10 V) Control |
0
|
0
|
||
| Analog Current (4-20 mA) Control Input |
0
|
0
|
||
| Isolated Analog Current (4-20 mA) Output (Configurable Data Source) |
0
|
|||
| 1-2 ms Pulse (RC PWM) |
0
|
* | ||
| Toggle (Simple On/Off for Extend/Retract) Control |
0
|
|||
| Pre-set Position Control |
0
|
* | ||
| Isolated Digital Inputs | 2X | 1X | 3X |
0
|
| Transient Voltage Protection on Signal Lines |
0
|
0
|
0
|
|
| Deepsea Operation to 6,000 meters (10,000 PSI) *AU Series Only |
0
|
* : Contact Ultra Motion to discuss this feature.
Tech Specs
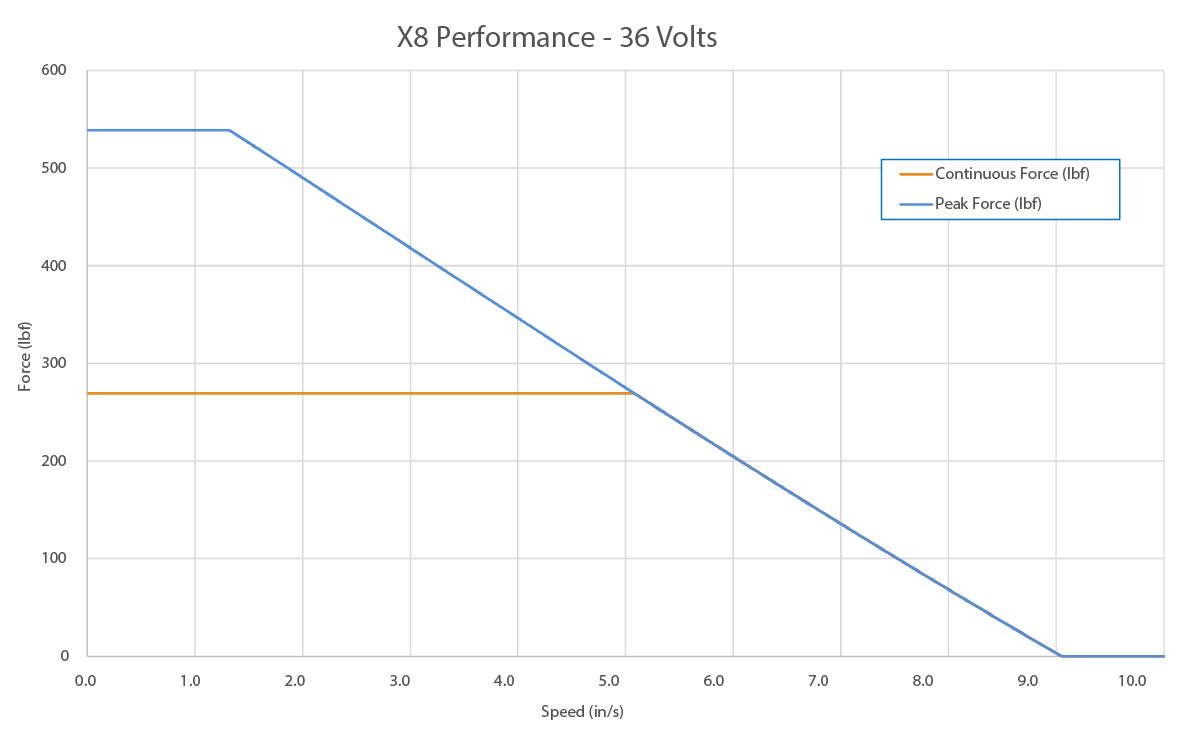
Force: Up to 270 lbf continuous, 530 lbf peak
Speed: Up to 14 in/s
Linear resolution (with acme screw): 0.000061″ (1.55 µm)
Operating Voltage Range: 8-36 VDC
Stroke Lengths: Up to 7.75”
Integrated Servo Cylinder Controller
• Advanced DSP-based motion control
• High-performance inverter stage
• High-speed Opto-Isolators
• Easy USB configuration
• Flexible GPIO with digital status or PWM output options
Performance
Phase Index®
How is it used?
The first commercial implementation of Ultra Motion’s Phase Index® position sensor technology, used in a demanding aerospace application, has performed flawlessly through extensive and rigorous environmental testing and field operations. Ultra Motion is now adapting this proven sensor technology to a range of designs from high-performance, high-power-density aircraft actuators, to low-cost industrial motion control. Phase Index® actuator position sensing technology is available exclusively from Ultra Motion, so contact our engineers to find out how it can work for your application.

How Does it work?
The Phase Index® position sensor works by using the phase relationship between two cyclic signals with different periods to determine absolute position within a larger interference cycle of the combined signals. When implemented with state-of-the-art magnetic sensor technology, this technique allows for a high-speed, high-resolution, digital actuator position sensor that is always accurate and that works across a range of harsh environmental conditions.
Operating Modes
Command Line Interface
Available on Classic, Industrial and CANopen* ControllersThe Servo Cylinder has a serial command line interface (CLI) that offers the user complete control over all performance parameters, motion commands*, and diagnostic information.
- Classic Controller (Option Code N): Full Duplex RS-232
- Industrial Controller (Option Code P): Full Duplex RS-422
- CANopen Controller (Option Code C): Half Duplex RS-485
The Servo Cylinder can be controlled through a terminal program such as PuTTY, a PLC, or any program that can control a serial communication port such as LabVIEW, MATLAB, Python, etc. The Servo Cylinder can be configured to operate in “Human mode” where detailed information regarding commands and asynchronous error messages are output to the terminal window. The Servo Cylinder can also be set to operate in “Machine Mode” where asynchronous messages are turned off, checksums are sent to ensure communication integrity, and communication bandwidth can be greatly increased. *Motion cannot be commanded via serial with the CANopen Controller
Proportional Modes
Available on Classic and Industrial Controllers*The Industrial Controller includes a configurable isolated 4-20 mA output for easy integration with analog PLCs. *1-2 ms Pulse Mode is available only on the Classic Controller. Proportional modes take full advantage of the benefits that the integrated Phase Index® absolute position sensor has to offer. The user simply supplies a signal proportional to the desired position, and the Servo Cylinder immediately responds. There is no homing required so the user does not have to worry about intermittent power interruptions causing downtime or failure of their machine due to loss of position. Software definable end-of-stroke limits eliminate the need for limit switches. The user simply configures the stroke range, and the corresponding proportional input signal range, and the Servo Cylinder is ready to use.
Voltage Mode Example Configurations
| Voltage Min | Voltage Max | Position Min | Position Max |
|---|---|---|---|
| -10V | +10V | Full Retract | Full Extend |
| 0V | +5V | 2.000″ | 3.125″ |
| -5V | +5V | Full Retract | 1.500″ |
Current Mode Example Configurations
| Current Min | Current Max | Position Min | Position Max |
|---|---|---|---|
| 4 mA | 20 mA | Full Retract | Full Extend |
| 4 mA | 16 mA | 2.000″ | 3.125″ |
| 10 mA | 20 mA | Full Retract | 1.500″ |
1-2 ms Pulse Mode Example Configurations
| Pulse Min | Pulse Max | Position Min | Position Max |
|---|---|---|---|
| 1 ms | 2 ms | Full Retract | Full Extend |
| 1.2 ms | 1.8 ms | 2.000″ | 3.125″ |
| 1.5 ms | 2 ms | Mid Stroke | Full Extend |
CAN Mode
Available on CAN ControllerThe CAN controller has firmware options for either a simplified CAN 2.0B compatible protocol that can be configured for use in a wide range of systems, or CANopen per CiA DS301/DS402 with support for cyclic synchronous position and profile position modes. The CAN controller has a half-duplex RS-485 serial connection for diagnostics, configuration, and field updating of the firmware.
Incremental Modes
Available on Classic ControllerIncremental input modes allow for many users to realize the benefits of the Servo Cylinder without upgrading their existing control system or PLCs. The Servo Cylinder will provide high performance BLDC actuation using the following as position commands:
- Step & Direction
- CW/CCW
- Quadrature Signals
As with all operating modes, there is no homing required. The absolute position of the actuator can be read via the RS-232 Command Line Interface, or output as a 1 kHz PWM waveform from one of the Servo Cylinder’s output pins. Software definable end-of-stroke limits eliminate the need for limit switches. This mode allows the Servo Cylinder to behave as a drop-in replacement to stepper motor systems while providing higher efficiency, increased torque at high speeds, no lost steps or stalling, and smoother operation in an integrated package. The configurable GPIO can output a PWM signal proportional to the absolute position of the Servo Cylinder, or the absolute position can be read directly over serial, eliminating the need for homing and external absolute position sensors. Two high speed optically isolated digital inputs reject noise and provide robust communication between PLCs and the Servo Cylinder.
Toggle Mode
Available on Classic ControllerThe Servo Cylinder mimics the simplicity of a brushed DC control system with the added performance benefits of a high efficiency, long life BLDC motor. The actuator immediately responds to a user supplied extend/retract signal sent to the optically isolated digital inputs. The absolute position capability of the Servo Cylinder eliminates the need for external limit switches and also allows for user configurable acceleration and max velocity for smooth, controlled motion. Speed or Torque can be controlled by using one of the Servo Cylinder’s analog inputs.
Preset Positions
Available on Classic ControllerFour Preset position mode provides the user with an easy way to perform a variety of positioning tasks. The user selects one of four pre-configured position by toggling the state of the two optically isolated digital inputs (00,01,10,11), causing the actuator to move to the selected position using the Servo Cylinder’s built-in trajectory generator. Homing is not required, which increases the ease of integration into machines and reduces complexity. A user defined input filter is available to reject noise and debounce mechanical switches.
Integrated Controller Options
| Control Modes & Features | Classic ControllerOption Code “N” | Industrial ControllerOption Code “P” | CAN ControllerOption Code “C” | Deepsea Controller Option Code “Q” |
|---|---|---|---|---|
| RS232 Serial w/ Command Line Interface (CLI) |
0
|
|||
| RS422 Serial (Full-Duplex, 4-wire) w/ Command Line Interface (CLI) |
0
|
0
|
||
| RS485 Serial (Half-Duplex, 2-wire) w/ Command Line Interface (CLI) *Does not command motion |
0
|
* | ||
| CAN 2.0B (Configurable Protocol) |
0
|
0
|
||
| CANopen (CiA DS301, CiA DS402) |
0
|
|||
| Analog Voltage (-10 V to +10 V) Control |
0
|
0
|
||
| Analog Current (4-20 mA) Control Input |
0
|
0
|
||
| Isolated Analog Current (4-20 mA) Output (Configurable Data Source) |
0
|
|||
| 1-2 ms Pulse (RC PWM) |
0
|
* | ||
| Toggle (Simple On/Off for Extend/Retract) Control |
0
|
|||
| Pre-set Position Control |
0
|
* | ||
| Isolated Digital Inputs | 2X | 1X | 3X |
0
|
| Transient Voltage Protection on Signal Lines |
0
|
0
|
0
|
|
| Deepsea Operation to 6,000 meters (10,000 PSI) *AU Series Only |
0
|
* : Contact Ultra Motion to discuss this feature.
Downloads
Product Spec Sheet
Manuals
Quick Start Guides
Reference Guides
Tools
Video
Quality Control
Each Servo Cylinder equipped with an -N- or -P- controller undergoes thorough acceptance testing on an automated fixture before being shipped to a customer. The specialized test fixture is equipped with a Servo Cylinder to apply loads to the test unit, an external optical strip encoder, and a load cell.
The following sections and downloadable PDF document provide detailed information regarding the acceptance test procedure. This is provided to help the user understand how to apply the test results to their application and to better understand the Servo Cylinder’s capabilities.
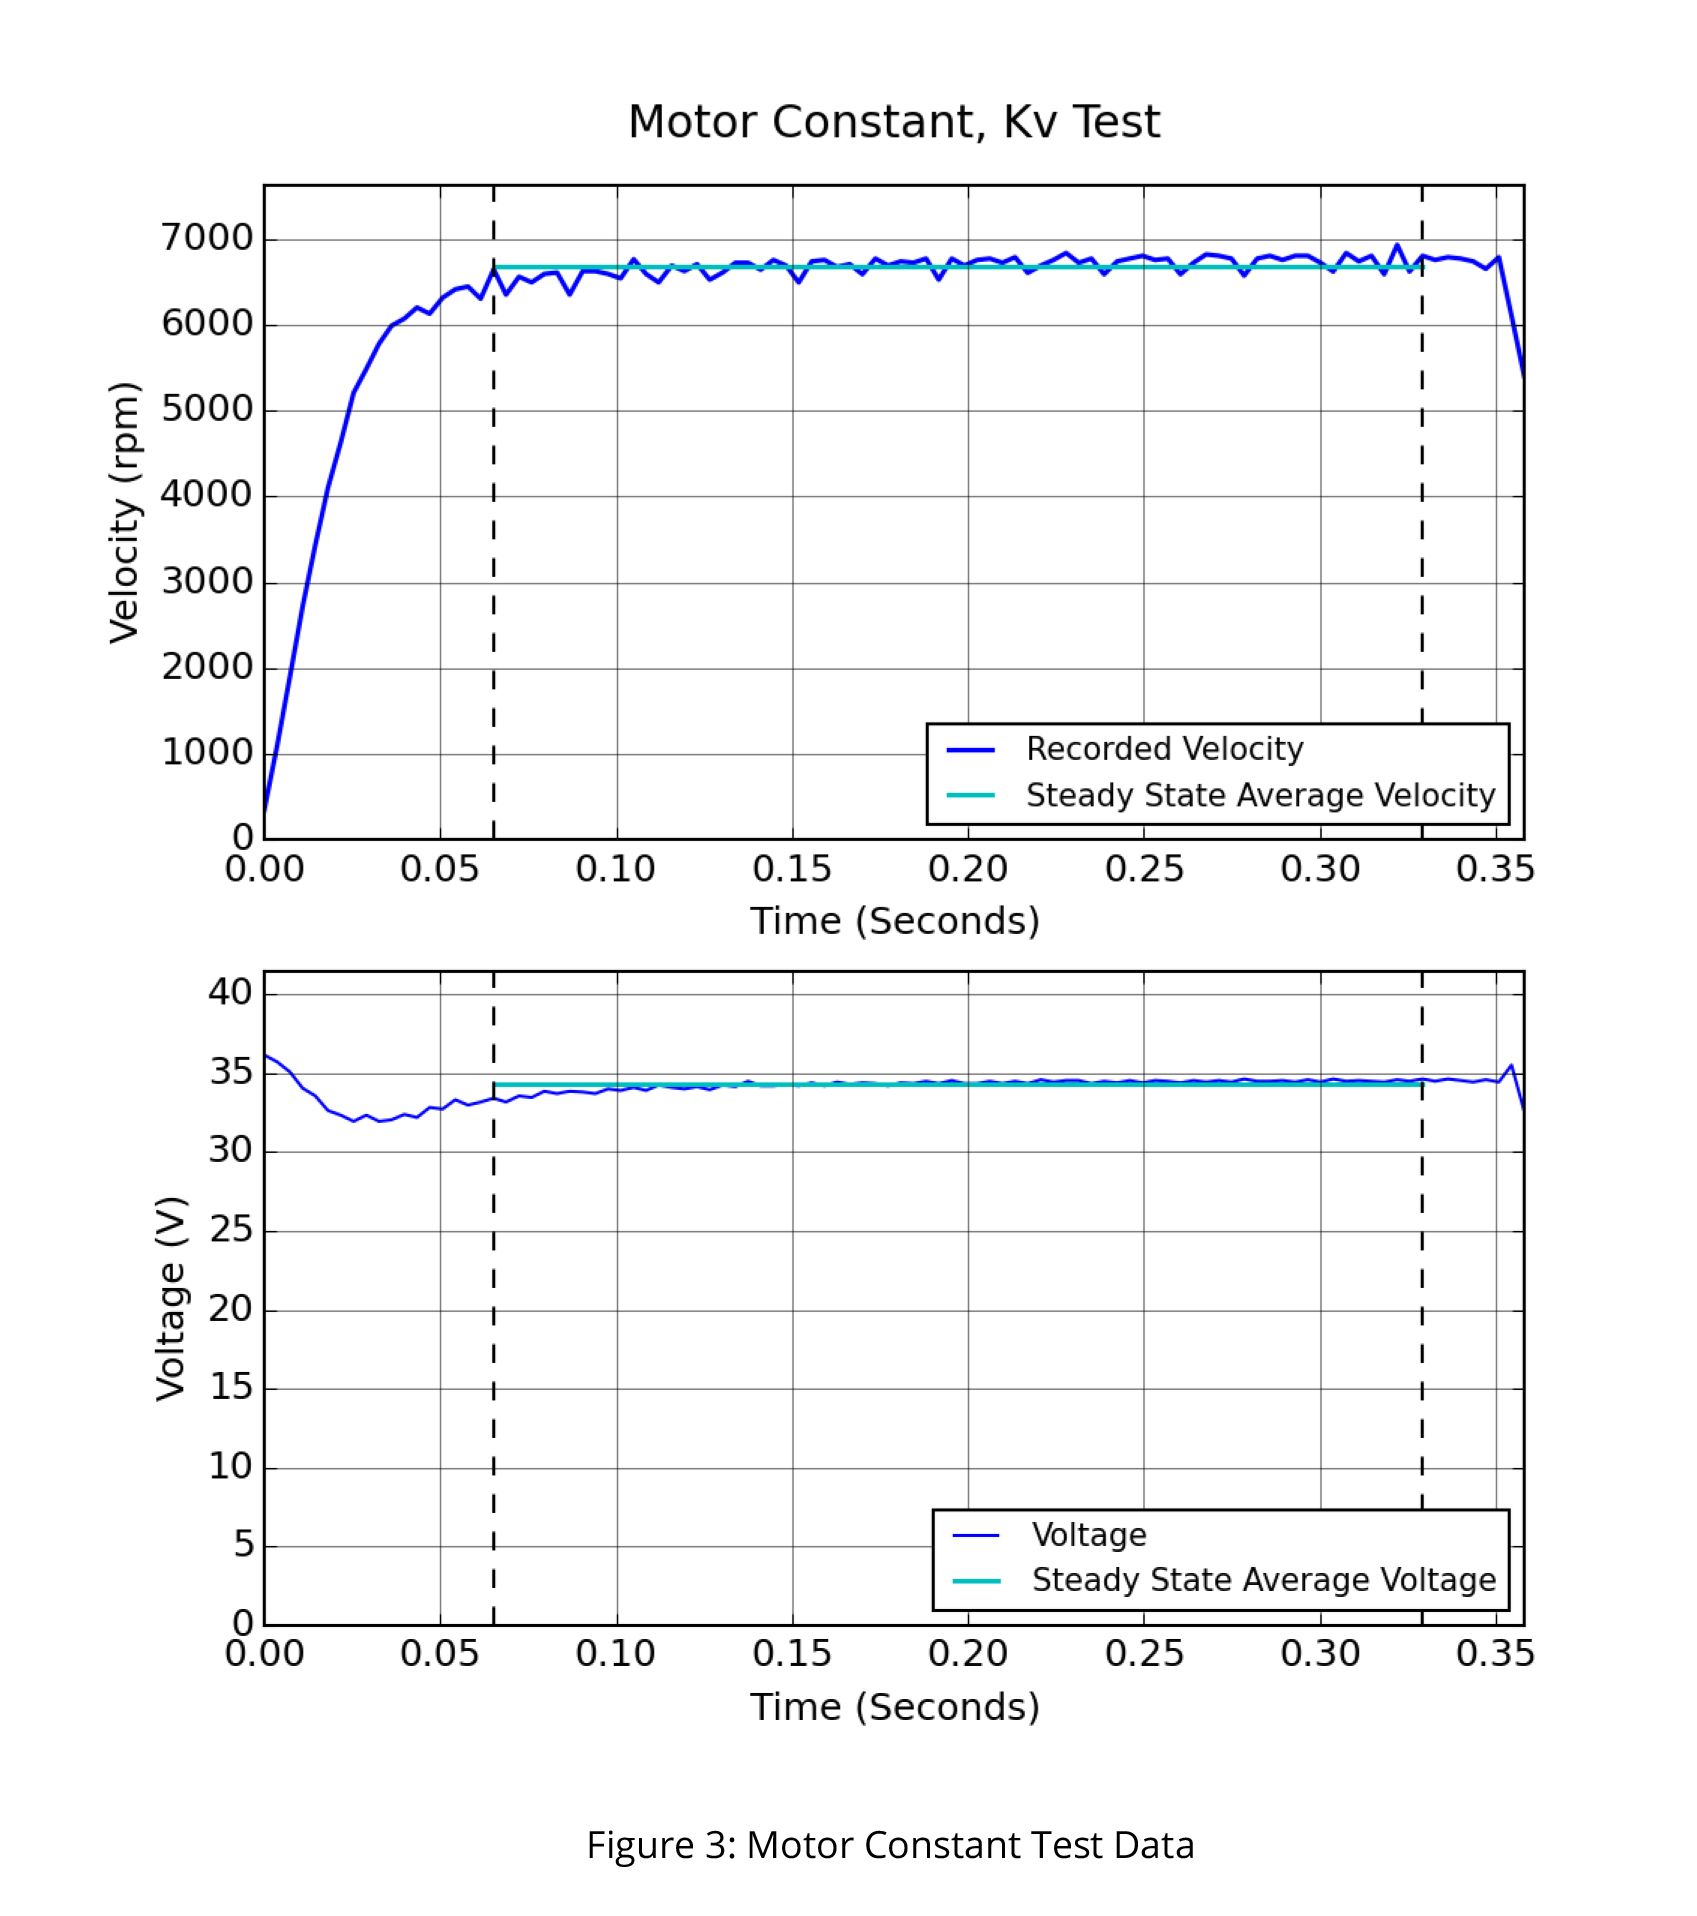
The actuator’s motor constant is measured by commanding the actuator to run at its maximum possible torque/speed while moving between the spMin and spMax positions and recording position, time, and supply voltage, in a completely unloaded state. This data is processed to reveal the motor constant Kv = steady state speed (rpm)/ steady state supply voltage (Volts). We also calculate the actuator constant as Kva = steady state speed (in/s)/ steady state supply voltage (Volts). Figure 3 shows the data from this test as it appears in the main body of the report for the example actuator. The calculated motor constant and actuator constant can be found in the data table. In this case the motor constant, as shown in Table 3, is 200.1rpm/Volt, which is typical. Note that this test, and all other tests are conducted using a 36V Ultra Motion Power Supply.
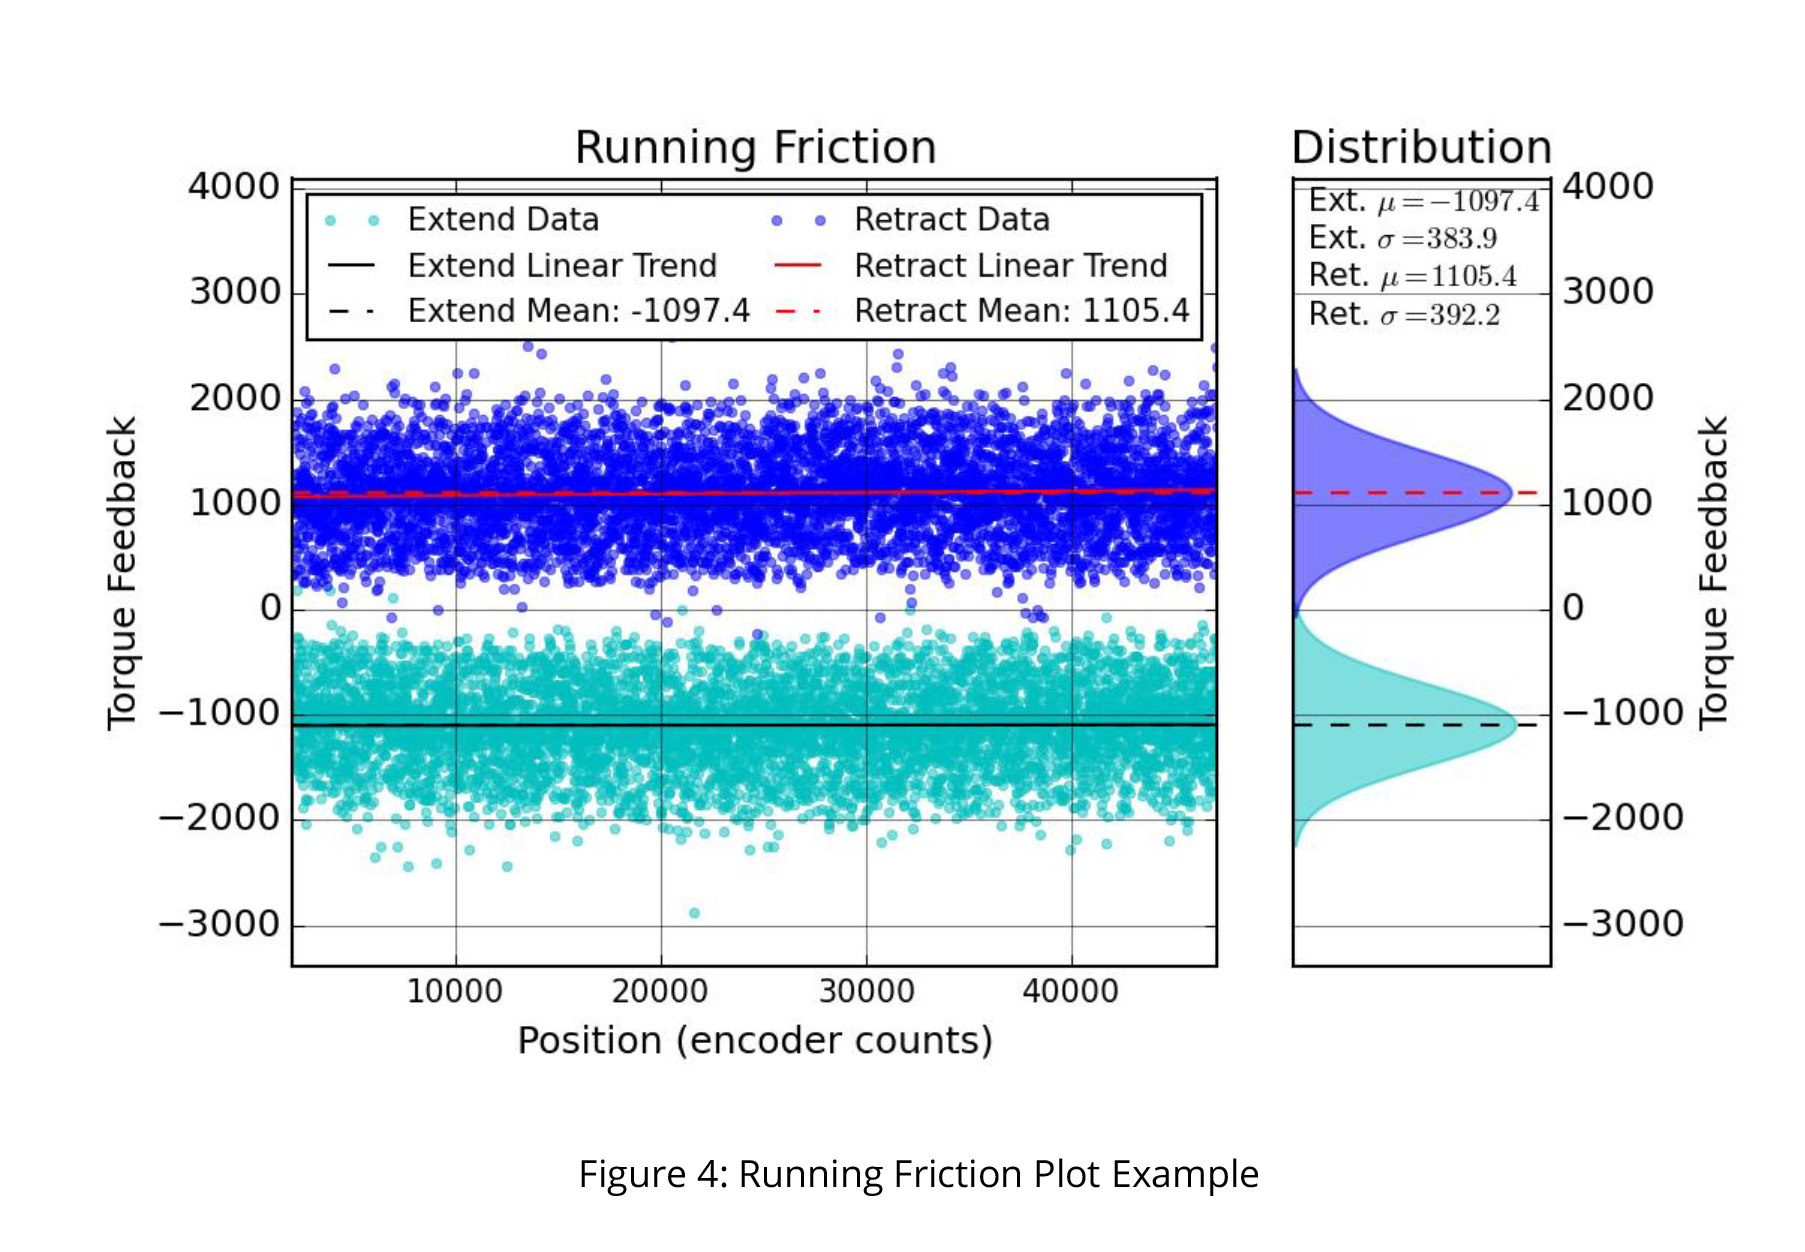
During the running friction test, the actuator is given trapezoidal trajectory commands to slowly extend and retract between the spMin and spMax positions. The actuator speed is set to 50,000, and the actuator is configured to stream position and the motor torque required to maintain the constant speed trajectory. For constant speed motions, torque feedback (sometimes referred to as Motor Current/Streaming Variable 3) defines the torque required to overcome resistance to the defined motion. In an unloaded state, at a low speed, external forces and internal viscous forces are eliminated, enabling us to use the torque feedback measurement as a measurement of the internal friction of the actuator, as well as the base level of torque required to move the actuator. Torque feedback uses the same units as the actuator max torque setting. Most actuators require an average of 1,000 torque counts to overcome internal frictions. This data is displayed for both the extend and retract motions in the running friction plot in the main body of the Test Sheet. An example of this plot is shown in Figure 4. Looking at this example, we can see the average torque values, as well information on the spread of the data, which is a function of the stiffness of the PID control loop used to regulate position, as well as internal bind points or imperfections in the screw. This information is used by Ultra Motion to determine if an actuator meets shipping requirements. The data collected in this test is closely related to the backdrive force test, which is an external measurement of the force required to extend the actuator at low speed.
The viscous friction analysis is conducted by commanding trajectory moves with different speed settings, while recording position, time, and torque feedback. Data from the steady state portions of these movements is processed to give steady state average torque output, which is plotted against steady state speed in inches of actuator extension per second. The linear trend observed in the viscosity test plot (Figure 5), allows us to calculate the average torque required to operate the actuator at any running speed. See Figure 5 for a detailed explanation of test results.
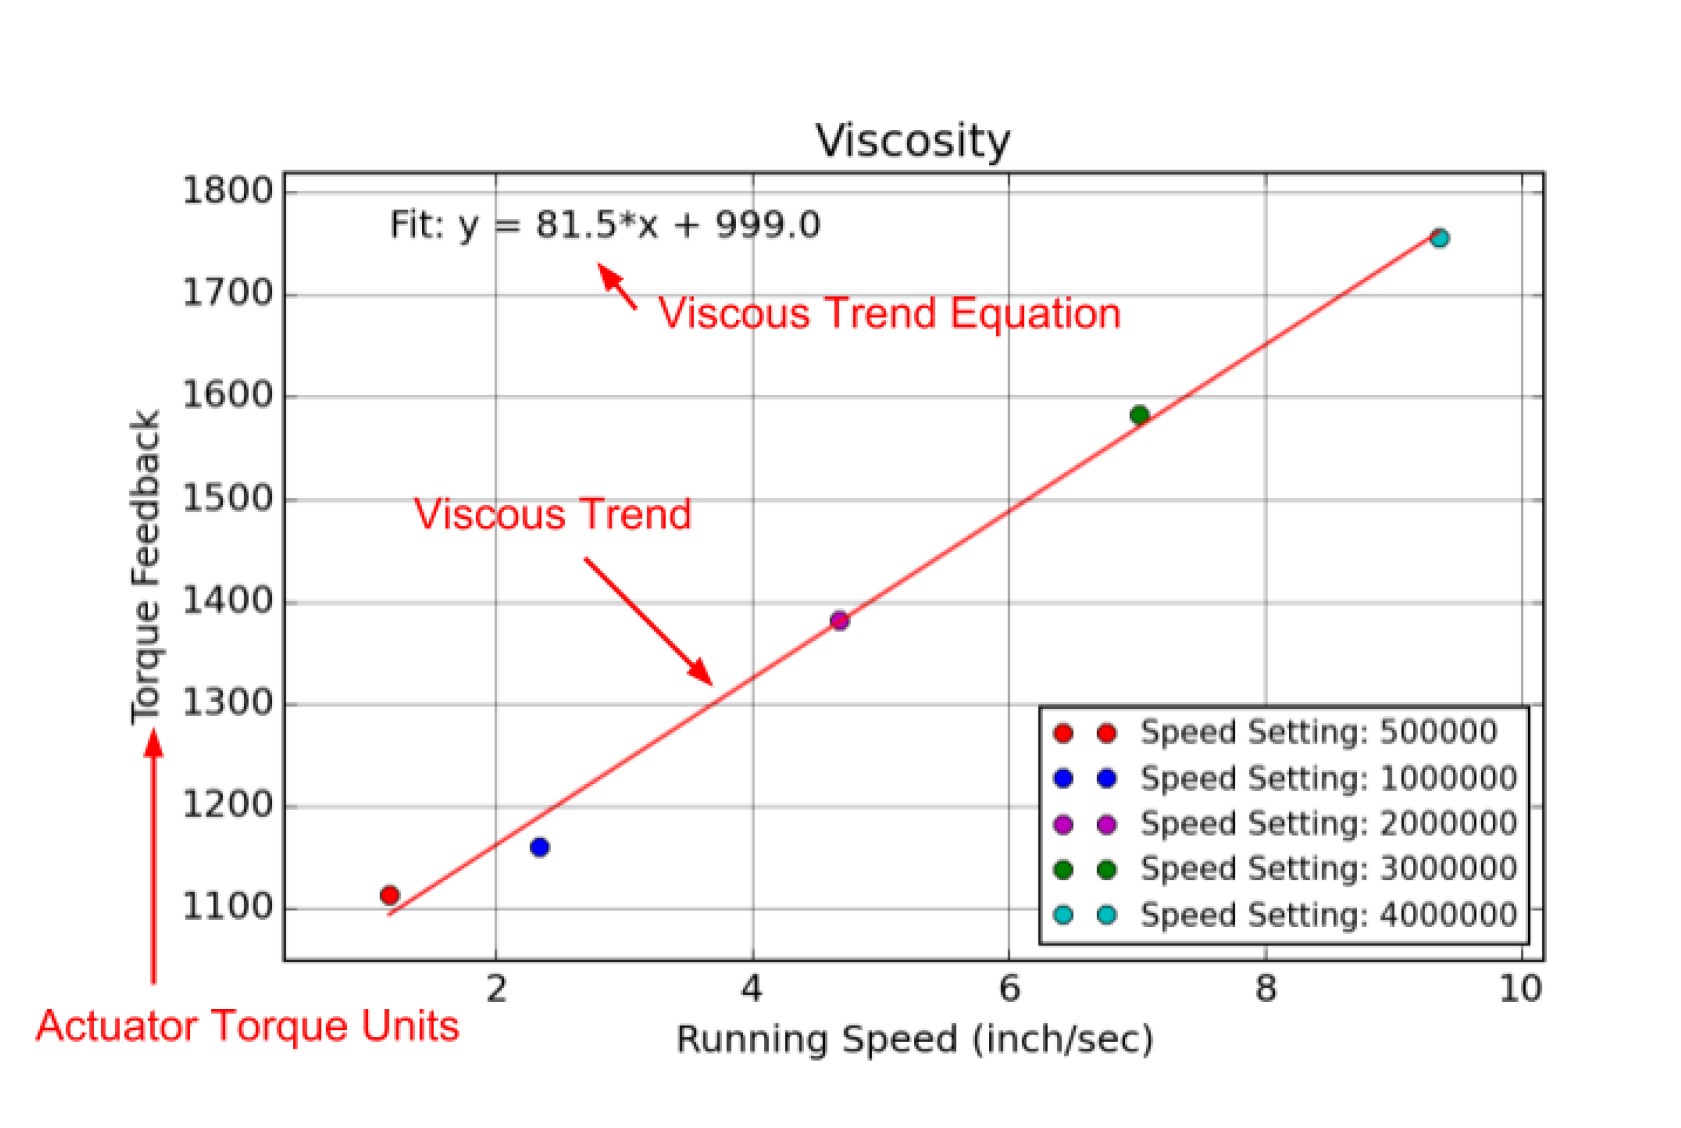
Figure 5: Viscosity Test Data Explanation. The actuator viscosity constant is measured in terms of internal torque feedback per running speed in inches per second, and is calculated based on several running speed data points. This data can be used to anticipate the affect that running speed will have on force output. On this actuator, as running speed approaches 10in/s running friction is nearly doubled over the low speed running friction observed in the running friction test (Figure 4). These results can also be used to estimate the physical speed of the actuator based on the trajectory speed setting, by matching the speed setting in the legend to the running speed indicated by each data point. Actuator viscosity is caused largely by viscous effects within the motor windings (iron losses), and viscous effects of the grease lubrication. If the viscous constant is very high, this can be an indication that the motor has been damaged.
The backlash analysis measures the zero-load lead screw backlash, which is not captured by the Phase Index® encoder, at the stroke midpoint. This is accomplished by commanding the actuator to its midpoint, loading the actuator in compression to ensure that the backlash is fully actuated, and then slowly unloading to a zero-load state with the actuator against one side of the backlash. This procedure is then repeated in tension so that the actuator is up against the opposite side of its backlash. The change in position during this procedure is measured with an external optical strip encoder with a resolution of 0.00002”, and is reported in the data table on the first page of the report. Backlash typically varies by up to 0.0005” over the full stroke. It is important to note that the effective backlash observed in use is also affected by changes in loading, which cause elastic deformation. See the accuracy analysis for more details about how this can affect performance.
The accuracy analysis compares the Servo Cylinder’s reported position to an external position measurement conducted with an optical encoder with a resolution of 0.5 µm, and accuracy of 3 µm/m.This test is carried out by loading the actuator with approximately 55 lbf in compression, and commanding the actuator to slowly progress from its fully retracted to fully extended positions, while recording internal and external position, and loading. The loading direction is then reversed to 55 lbf in tension, and the actuator is commanded to return from its extended to fully retracted positions. The observed difference between the internal and external position feedback is calculated as error for this full movment and is dispalayed in the accuracy test plot (Figure 6), as relative error vs reported position. This plot shows a comprehensive summary of overall error, including, in order of importance, backlash, axial deformation, lead error, and Phase Index® error along with localized loading variations. Backlash in this test is composed of the combination of the zero load backlash, measured in the backlash analysis, and the change in axial deformation casued by the the approximately 110 lbf loading differential in the shift between tension and compression. Axial deformation can be predicted based on the results of the axial stiffness analysis. The error introduced by axial deformation is emphasized in this test, to give the user accurate expectations for performance under varying loading conditions. Lead error is characterized by trends in the error extending over multiple motor revolutions, as displayed in Figure 6. Finally, the combination of phase index® uncertainty and small variations due to inconsistencies in the loading, are characterized by small osicllations in error. The peak to peak error for this example is approximately 0.006”, meaning that under similar loading conditions we can expect relative error to be at worst 0.006”.
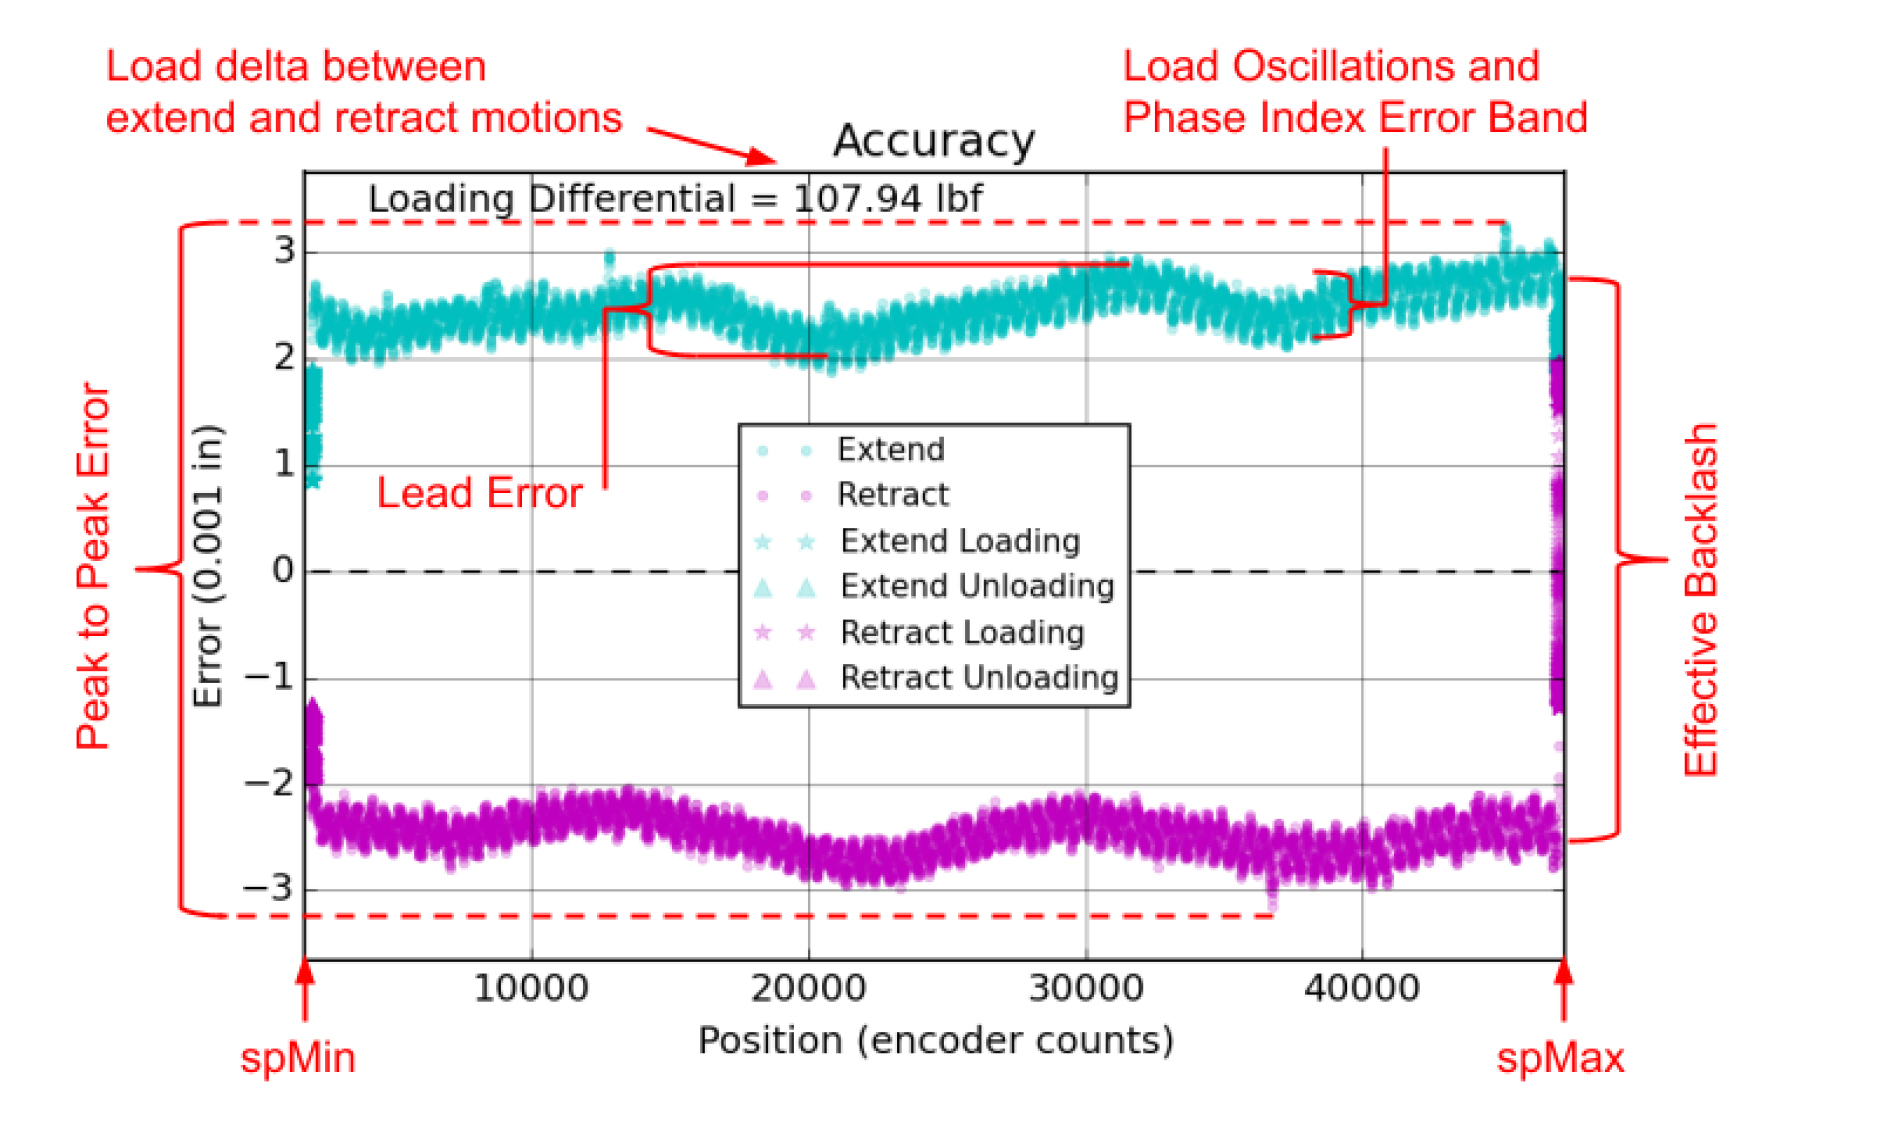
Figure 6: Accuracy Test Plot Explanation. The Accuracy plot shows overall worst case error measurements at the specified loading differential. In this plot we can see contributions to the overall error from several different sources including lead screw backlash, axial deformation, lead error, Phase Index® error, and small oscillations resulting from uneven loading. Axial deformation and backlash are observed together as effective backlash. For this actuator the zero load backlash is 0.00278” (see Table 3), and the expected axial deformation is approximately 0.002”, based on the axial deformation analysis at 108 lbf (Figure 7), so the effective backlash should be approximately 0.00048”, which is consistent with the observed results.
The axial stiffness analysis is conducted by commanding the actuator to maintain position at its spMin position, while the loading actuator applies a steadily increasing tensioning load. After a sufficient load has been reached, the loading actuator reduces load to zero, and the procedure is repeated at the extended spMax position. During each loading procedure internal and external position and load are recorded. Deformation is calculated as the relative motion recorded by the external optical strip encoder while the internal Phase Index® encoder reports no change. Data from this analysis is displayed in the Axial Stiffness plot (Figure 7). The stiffness constants displayed in the upper left corner of the plot can be used to estimate axial deformation under different loading conditions, although it is important to note that the actuator mounting configuration affects axial stiffness. In the test fixture the actuator is mounted in a shaft clamp style mount, most similar to the Ultra Motion Adjustable Clamp mount. Stiffness will typically be lower at the fully extended position, because more of the lead screw is under tension. This effect is exaggerated for longer stroke length actuators. To calculate expected deformation, for instance under the loading delta of 108 lbf indicated in the accuracy test, we can take an average of the two different fit equations, which should be approximately equivalent to the deformation at the stroke midpoint:
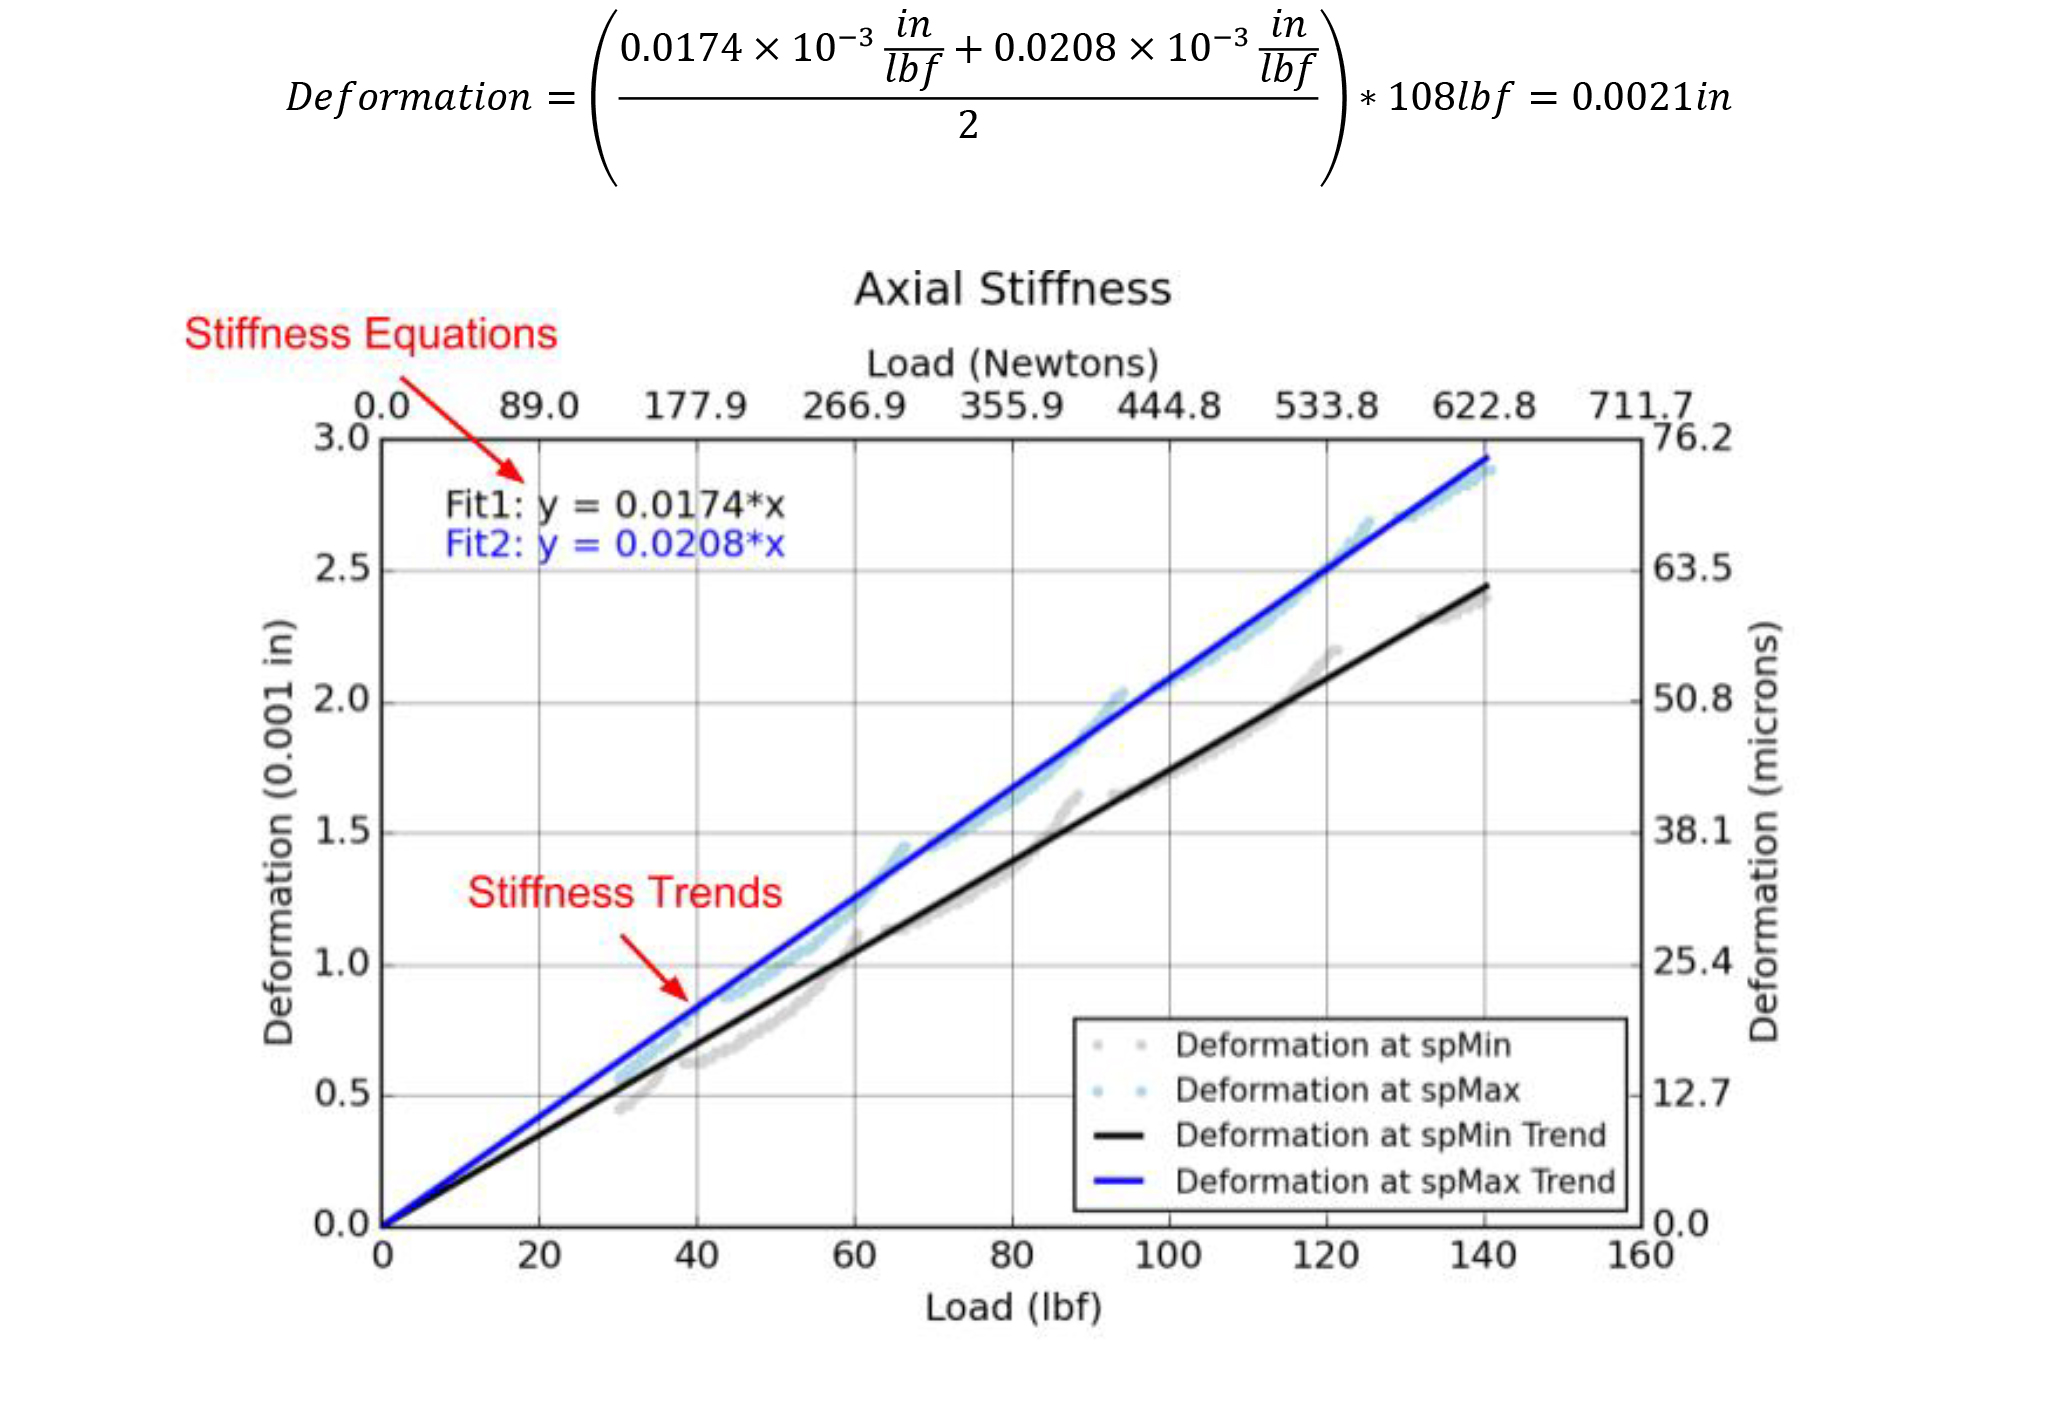
Figure 7: Axial Stiffness Plot Explanation. The axial stiffness trend is measured in tension at both the minimum and maximum extended positions. Typically these should be very similar, but with the fully extended position showing slightly less stiffness. Small peaks and breaks in the testing data are caused by the control system responding to increasing load, and can be ignored while analyzing mechanical deformation.
The force constant analysis is conducted by commanding the test actuator to slowly retract against the loading actuator, which supplies a steadily increasing load. Load cell measurements and internal torque output are recorded until a loading threshold is reached. The data collected is plotted in the Force Constant plot (Figure 8), along with a best fit line and the matching equation giving force output per applied motor torque. The force constant calculated in this test, along with the running friction and viscous friction measurements can be used to build a detailed force output model for the actuator:
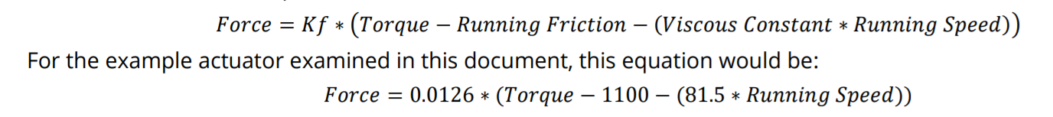
This relationship can be used to determine the torque that will be required to move against a resistive load. Users should note that the continuous torque limit for Servo Cylinder actuators is MT = 9000 for 100W motors and MT = 14,000 for 180W motors (assuming lab environments). As described in the Servo Cylinder manual, the torque limit of 9000 corresponds to approximately 100 lbf output for standard ballscrew actuators. The data shown in Figure 8 confirms this relationship. Setting the max torque over this limit should only done in cases where high force output will be momentary.
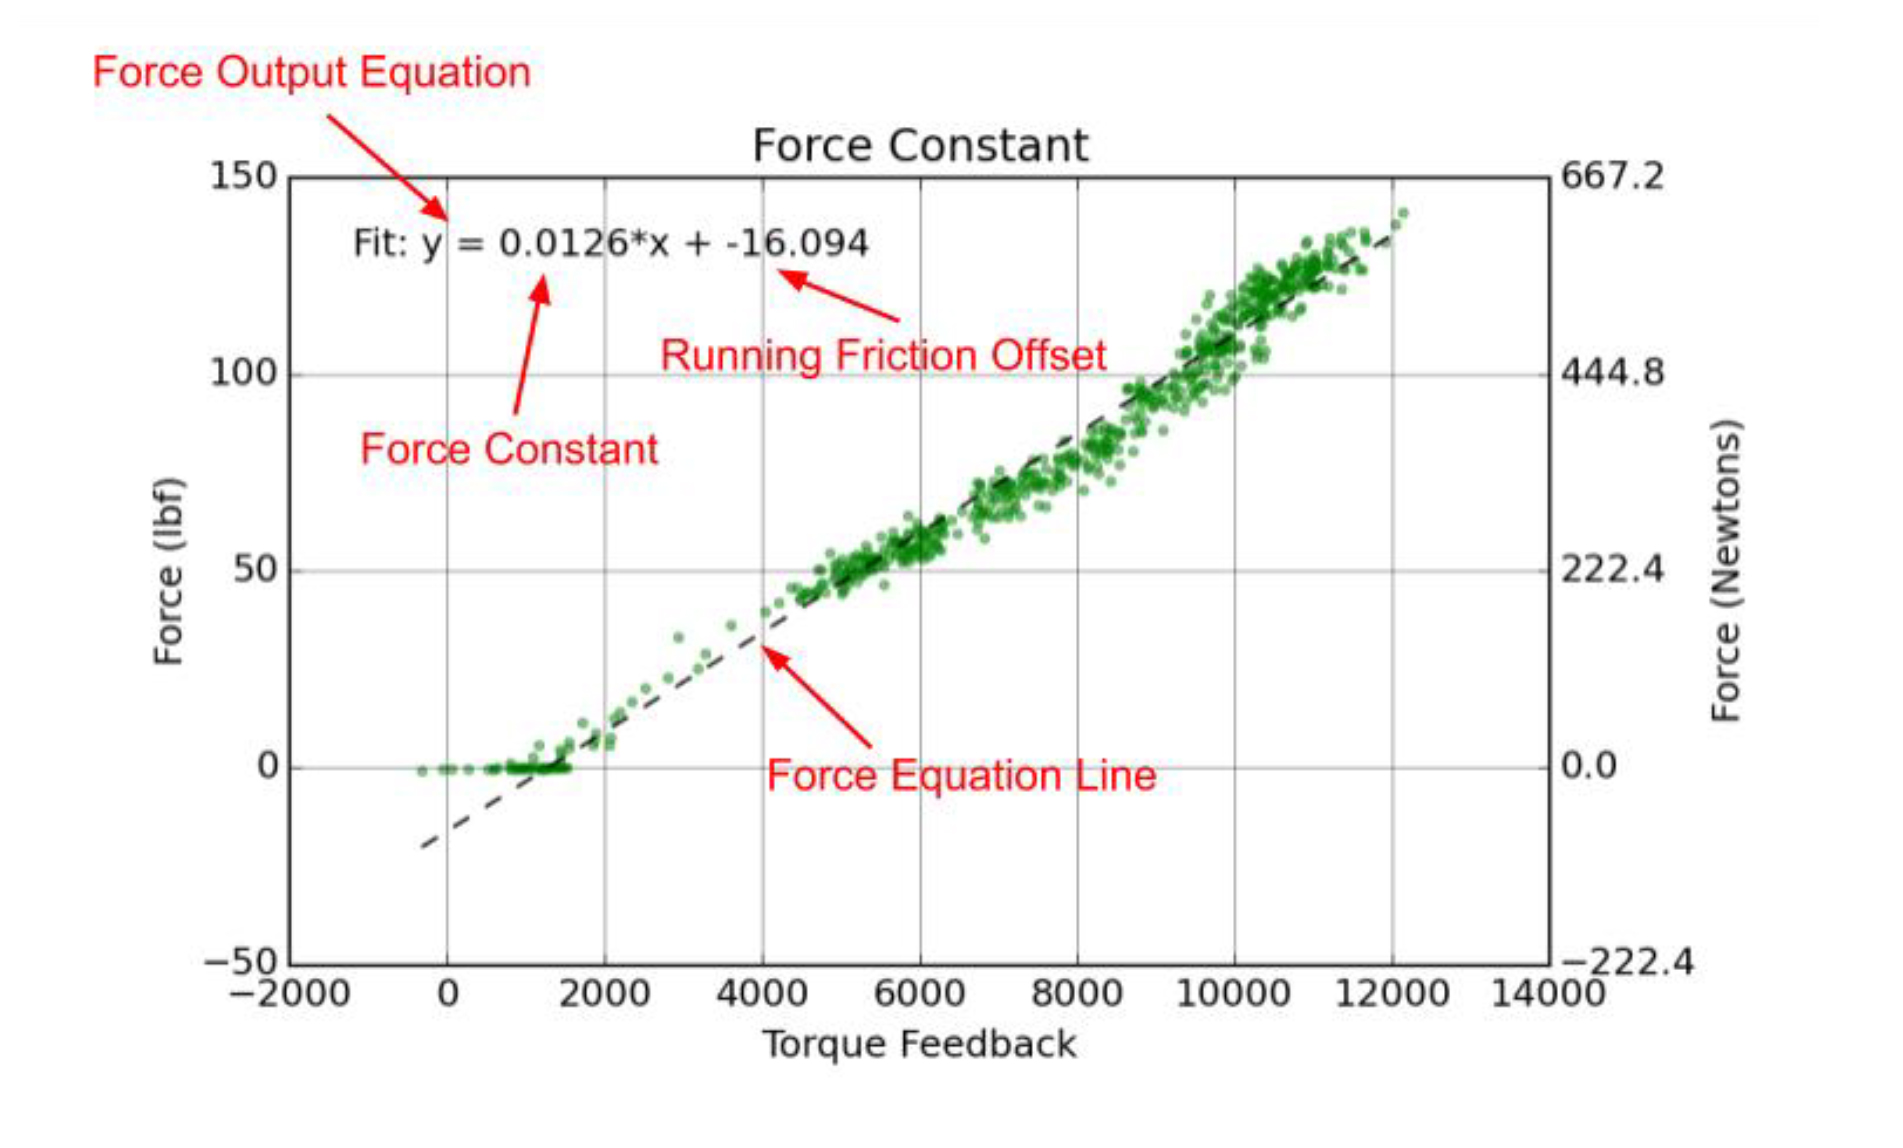
Figure 8: Force Output Plot Explanation. The force output analysis is conducted in tension, and captures the dynamic relationship between the torque reported by the actuator, and actual force output. Any time the actuator is moving it must overcome running friction, so we see no output force until the torque output goes above approximately 1000. This is consistent with the average running torque observed in the running friction test (Running Friction Analysis). Nonlinearities in the captured data result from varying efficiency in the lead screw and PID interactions between the loading actuator and the actuator being tested. Note that only a small portion of the actuator’s stroke is captured in this test.
The force required to backdrive the actuator is measured by “coasting” the test actuator at its retracted position, and commanding the loading actuator to steadily move from this position to the extended spMax position, while recording load cell readings and position. The results are displayed in the Backdrive Force plot (Figure 9). The average backdrive force is also reported in the data table.
Figure 9: Backdrive Test Explanation. The average required backdrive force should be similar, but not necessarily identical, to the running friction offset observed in the force constant analysis (Figure 8), due to small differences in forward and backdriving efficiencies. Peak force can be used as a measure of the maximum force required to start movement. The noisy appearance of the data is caused by a combination of once per motor revolution friction oscillations, and small scale imperfections in the lead screw which are typical.
The repeatability analysis measures the actuator’s ability to repeat a movement to the same position several times, under consistent uniaxial loading. In this procedure the actuator starts at the fully retracted position and then is commanded to an extended position, and back to the original retracted position, while the loading actuator provides a consistent tensioning force. This action is repeated several times while external position is recorded. The repeatability spread is taken to be the maximum difference in final position observed over all repetitions of this motion. The repeatability spread is reported in the Test Sheet data table.